Star-X Mirrored and Southern Versions


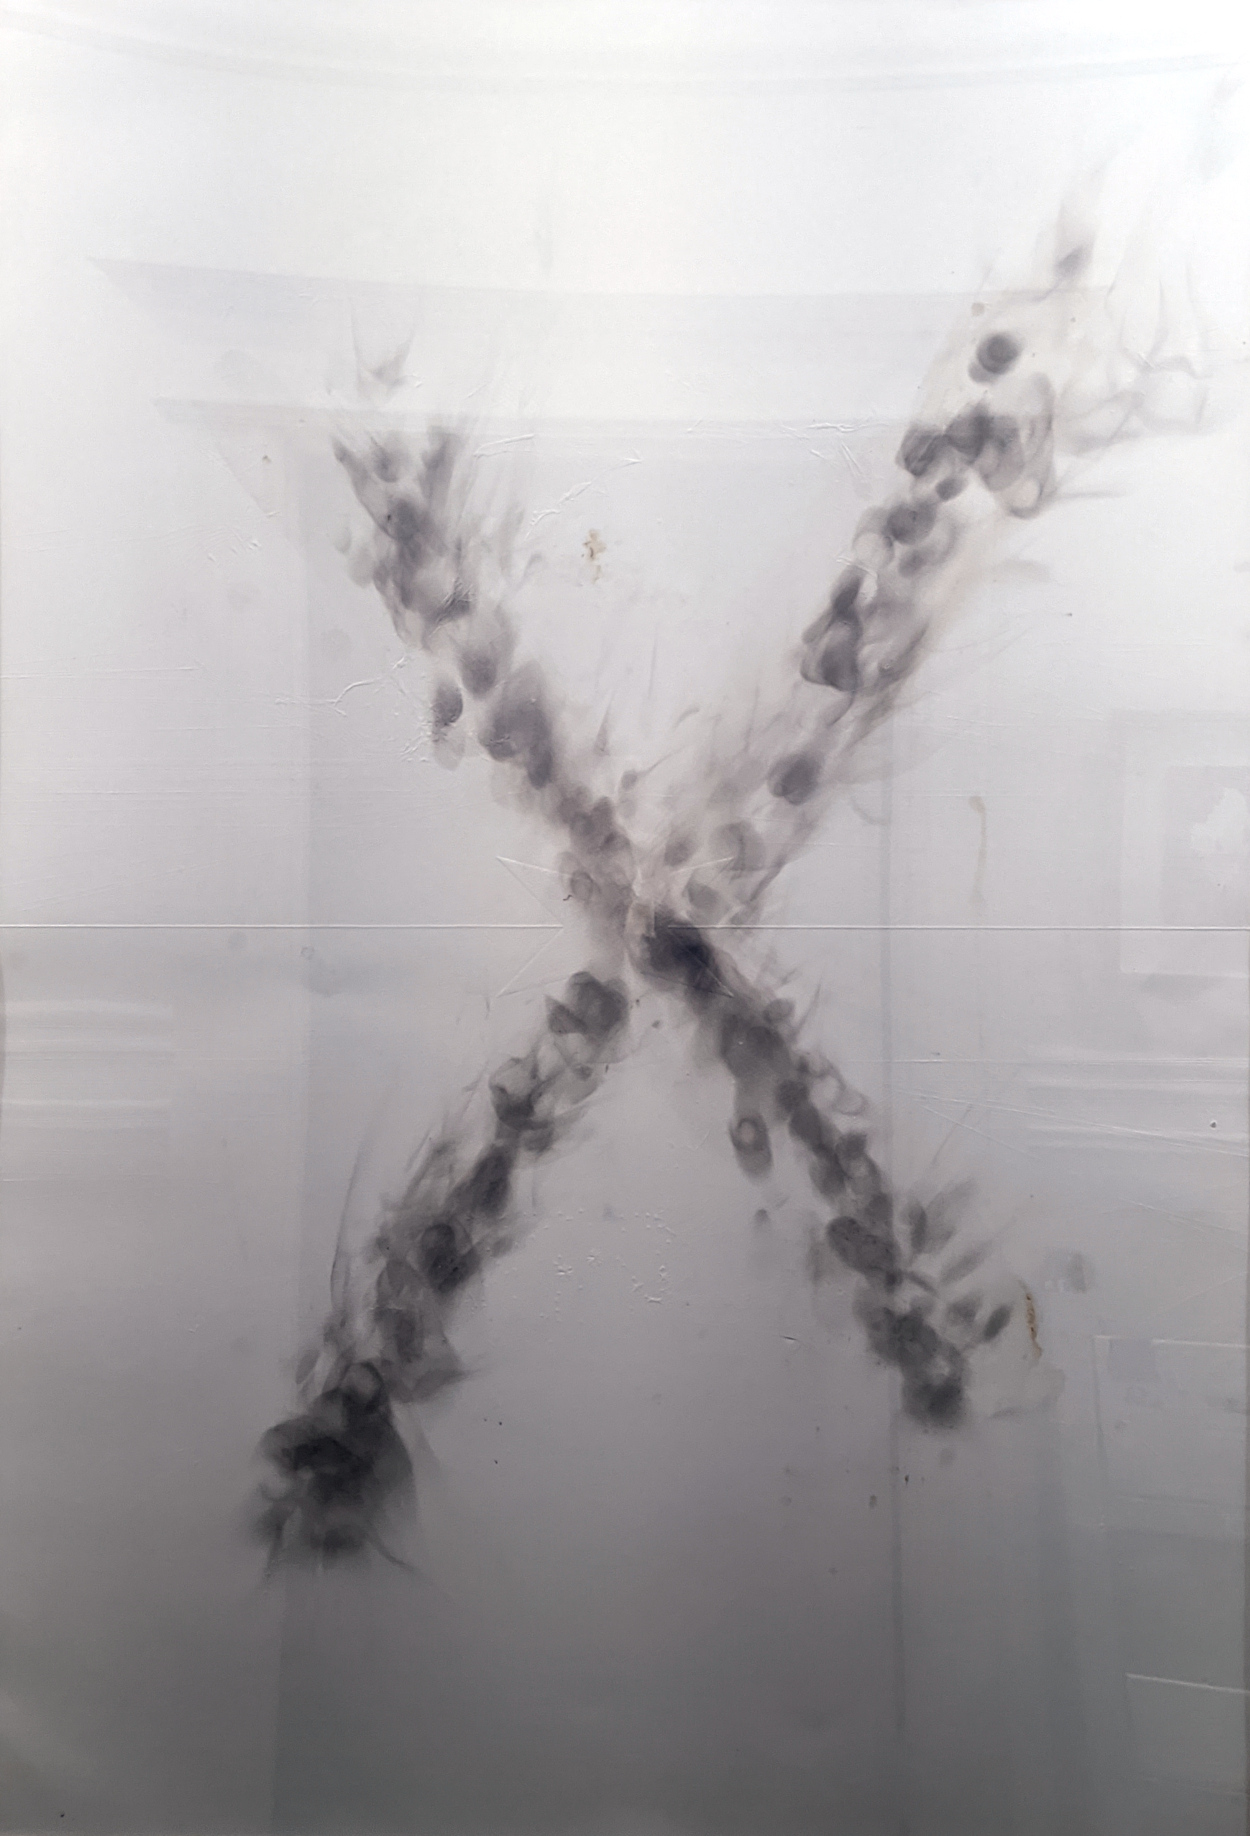
Variable display size. Portfolio of 9 experimental monoprints using laser-cut large-format debossing, oil-based ink, fluorescent blue, orange, and purple inks, LED strips, 1.5mm acrylic, wood frame, assorted hardware and wire cable. On 300g/msq white velvet somerset paper, 30 by 44 inches (760mm x 1120mm), with frame (34×48 inches). With Emily York and Courtney Sennish.

2023-ongoing


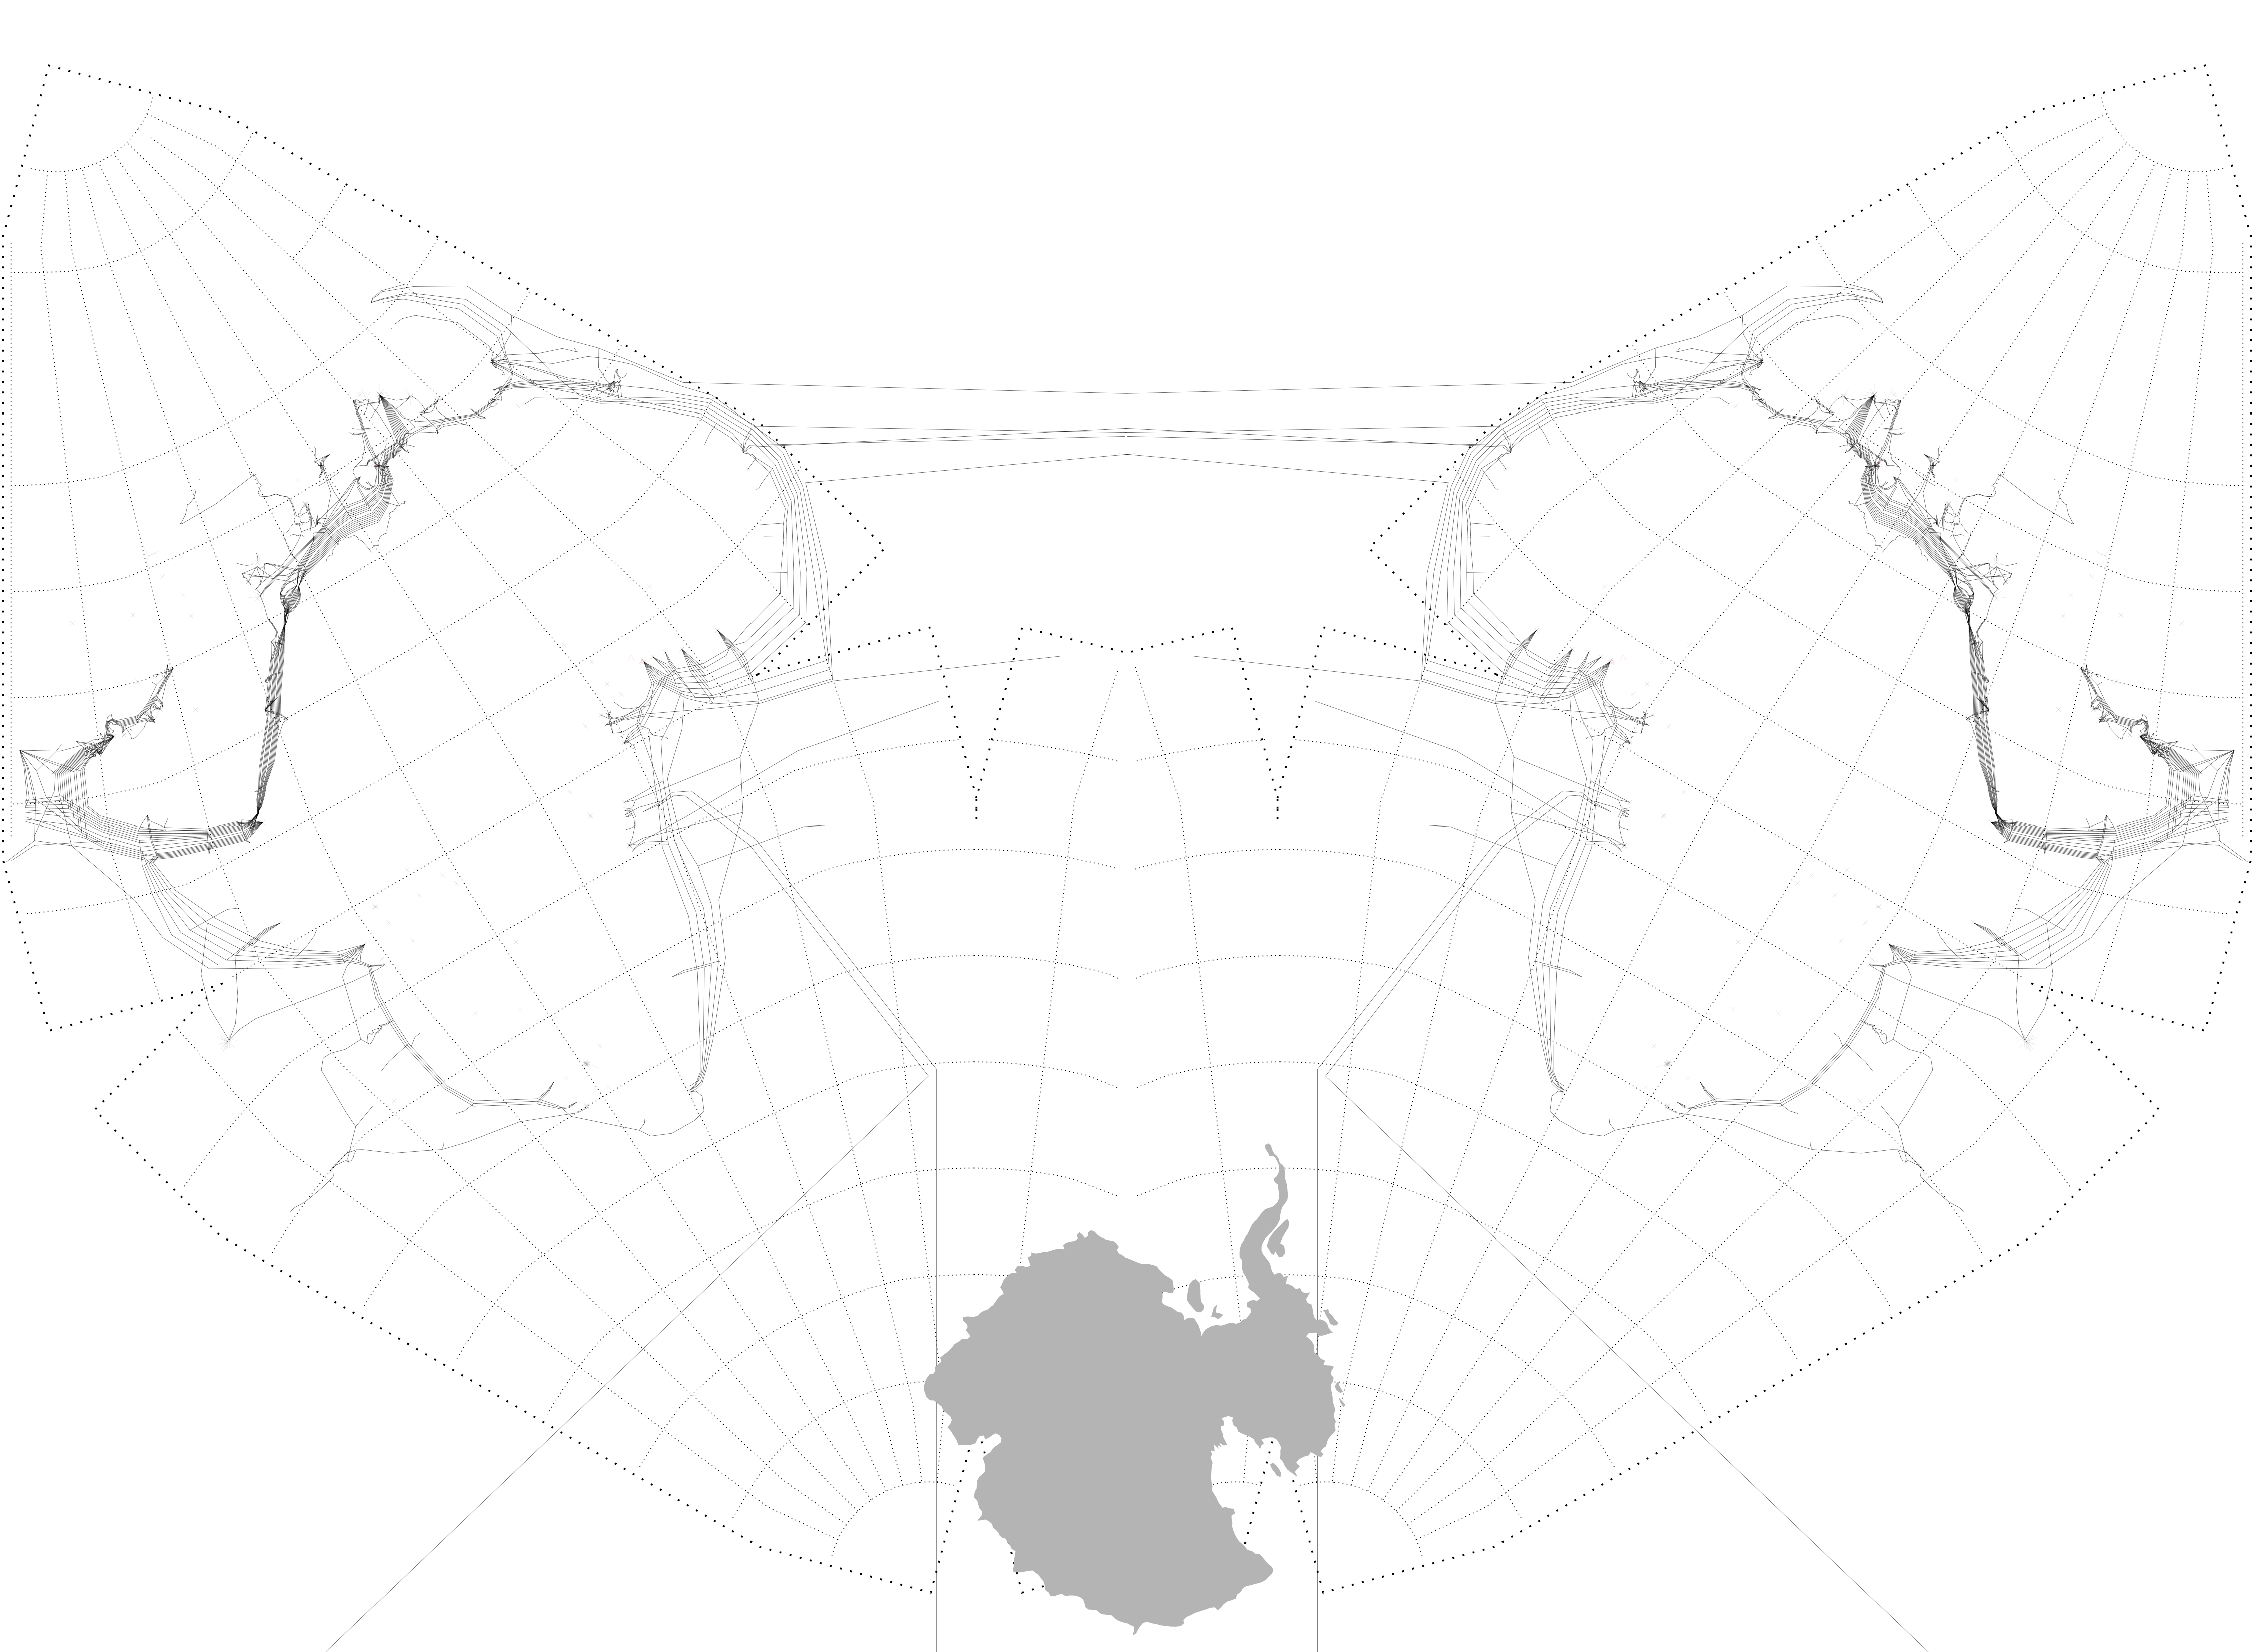
Two additional views based on the Star-X internet maps developed previously, but extends, distorts, and morphs them into something new according to specific design criteria that attempts to fix two specific design and conceptual flaws.

1. Southern Version.

Perspective play. Shifts perspective from centered on the globe from atop the North Pole one hundred and eighty degrees, to centered on the globe atop the South Pole, aka Antarctica. This continent is badly mangled in the Cahill-Keyes Butterfly M projection, and so the Southern Version centers it.

Although larger than Australia, Antarctica is often mangled, removed, or neglected in cartographic projections. This forgotten continent with an unremembered shape will gradually coming into visible relief in the next decades as climate melts the glacial ice hiding coastal land.

Working on this specific point, and who is centered and why in cartography, is why this is a de-colonial and not human-centered map.

This work was incorporated into the Star-X 2023 map, which incorporates an accurately sized Antarctica continent below (south) of South America. In addition to unifying the Antarctic, it provides a second orientation point to the central star representing the North Pole. This encourages viewers to turn the projection to the orientation that is the most natural to them.

The added asymmetry allows viewers to distinguish when the Americas are on the bottom of the map and when Europe and Asia are on the bottom of the map. So when a Star-X projection is being displayed in the Americas, Antarctica is on the bottom, and when a Star-X projection is being displayed in Europe or Asia, Antarctica is on the top.

2. Mirrored Versions

How to represent peer swarms for the African continent for two related films that were released five years apart? The media objects in question are Black Panther (2018) and Black Panther: Wakanda Forever (2023).

Studies for comparing internet phenomena in Africa and the vast sparsely populated Pacific Ocean, often overlooked regions for internet analysis.

Star-X Internet Cartography
Agnes Denes Cartography
Tauba Cartography

Star-X Internet Maps


Variable display size, displayed in multiple with optional 1080p projection. Portfolio of 3 burn/hope monoprints using laser-cut large-format debossing, lemon juice, isopropyl alcohol, lighters, flame, smoke and one imprint-only print. Open set of 3 with burn “X” monoprints one white print, on 300g/msq white velvet somerset paper, 30 x 44 inches (760mm x 1120mm). With Emily York and Courtney Sennish. Open set of 1 etched mirror in two parts, 30 x 44 inches. Two oceans symmetries: Atlantic and Pacific, 60 x 44 inches.

2022-ongoing


Hyper-symmetric map of the earth that allows 180 degree rotations and multiples with tiling for a future with more flexible thinking about the connected world. This is a vertically-compact re-design of the Cahill-Keyes Butterfly M map that re-centers around the North Pole and adds a unified Antarctica continent. This continues the work started by Buckminster Fuller with his Dymaxion map, and creates a hyper-symmetric/flippable world map centered on the North Pole without nation-state primacy, designed such that no part of the world “is on top.”

It includes infrastructure markings for

  • Submarine Cable / Fiber Links
  • Tor Exit Nodes
  • Internet Exchanges
  • Starlink Gateways
Used as the base projection for geolocation of internet phenomena.

MMRL

Media Metadata Research Lab (MMRL) is a San Francisco-based art research collective
working at the intersection of data visualization, digital art, and cultural analytics. We
develop quantitative and qualitative methods for measuring and representing diversity in
media. MMRL members are Abigail De Kosnik, Benjamin De Kosnik, Veronica Jackson, Matthew Jamison, and Jaclyn Zhou.

Included below are work-in-progress graphic outputs from an experimental intersectionality tagging and visualization system being developed by MMRL for film, television, streaming, web content, and social media.

More information is available in the MMRL repository.

Playing With Fire*


Inkjet on washi, folds, PVA adhesive, titanium-zinc white oil paint stick, mylar tape, washi tape, glitter, handwritten notes in graphite.

Playing With Fire* (Peer-Centered Network Map), double-sided inkjet and foldable. Dimensions 22H x 68W inches, unfolded. Edition of 5.

Upside-down At Any Angle (Peer-Centered Network Map), single-sided inkjet triptych of 31 x 22 inch panels. Dimensions 66H x 31W inches.

2019, 2020


Internet maps composed of three components: sixteen months of the locations of people that share gun files on the internet (black circles), the infrastructure of high speed optical fiber from submarine cables (yellow lines), and network bridges / exit nodes on the Tor network that link the internet to the dark web (red rays). The sampled data, the infrastructure data, and the dark web data are rendered onto the globe with a Cahill-Keyes projection.
On September 1, 2018, the United States Department of State banned Defense Distributed, a company in Texas, from the distributing files for the first 3D printed gun, the Liberator. These files immediately re-appeared on the dark web, on private download sites, attached as messages sent on phones, on peer-to-peer networks, and other networks all over the world. Since then, schematics for additional weapons have circulated, including AR-15, AK-47, Glock 17, and accessories such as large capacity magazines and bump fire gadgets. On the day of the ban, computers using custom software started sampling the internet to collect any data on users sharing these files, sampling peer-to-peer traffic to construct a sixteen-month history of network locations. The sampling effort, and the attempts to visualize this flow of virtual weaponry, continue into the present.

Data Practice Bibliography

boyd, danah. 2006. “Friends, Friendsters, and MySpace Top 8: Writing Community Into Being on Social Network Sites.” First Monday 11:12, December. http://www.firstmonday.org/issues/issue11_12/boyd/index.html

Hu, Yuheng, Lydia Manikonda, and Subbarao Kambhampati. “What We Instagram: A First Analysis of Instagram Photo Content and User Types.” ICWSM. 2014.

Keefe, Patrick Radden. “The Detectives Who Never Forget A Face.” The New Yorker, August 22, 2016.

Lee, Pamela. “Identity Theft.” Jessica Silverman Gallery text

Liu, Alan. “Transcendental Data: Toward a Cultural History and Aesthetics of the New Encoded Discourse.” Critical Inquiry 31 (2004): 209-38.

Liu, Hugo. “Social Network Profiles as Taste Performances.” Journal of Computer-Mediated Communications 13 (2008): 252-275.

Manovich, Lev. “The Anti-Sublime Ideal in Data Art.” Lev Manovich. 2002. 2016-07-20.

Manovich, Lev. “Notes on Instagrammism and contemporary cultural identity.” 2016.

Ostrow, Saul. Decoding O’Doherty, Art in America. December 2007.

Paglen, Trevor. Scripts, http://www.fotomuseum.ch/en/explore/still-searching/articles/26979

Whitelaw, Mitchell. “Art Against Information: Case Studies in Data Practice.” The Fiberculture Journal 11 (2008 DAC conference proceedings).

DTL 16, Data Transparency Lab

FAT-ML 16, Fairness Accountability Transparency in ML

Marihuana Smokes Herself

De_Kosnik_MFA_Medium_01


Three LED displays, wall mounts, 3 media files, 2 lights, 2 framed photos, 2 cloth pots, one rug, one sofa, two freestanding tumbleweed sculptures. Dimensions H x L x W (9′ x 9′ x 9′).

2016


Three channel video installation featuring a supercut of clips extracted from film and television depicting cannabis use, production, and distribution. My practice is to watch media and note any cannabis on the screen, as if I were a media censor in a time and space of total cannabis prohibition. Over time,this process has created a growing archive of clips that depict cannabis as a character in the larger war on drugs. The sequenced clips in this video installation use this archive, but only the parts that contain a female character on the screen. This subset is further  shaped by new searches gathered from exit interviews, and then using these terms to create subsequent loops with suggested searches such as “giggling,” power and money, dealing, actual medical use, and others.

Broken Obelisk / Visual ChangeLog

visual-cl-broken-obelisk-2016-5


Two inkjet prints (each 18″ x 84″), momigami wrinkles, cast concrete, EMT conduit, LED lights, arduino, sensors, custom software, google drive archive. Dimensions H x L x W (8′ x 6′ x 3′).

2016


New media sculpture and advertisement for a virtual archive hosted on Google Drive. The archive includes all the reading, projects, visual reference material, and audio recordings made over a three-month period at the end of 2015. Entries to the archive were indexed by a written log, aka ChangeLog, a text file that records participation details: in this case, it includes hours consumed by participants, size of media contributed, storage location in the archive, and date.